Setup
library(tidyverse)
library(DiagrammeR)
Separating concept and appeal
It can be useful to separate the content or concept from its graphical/visual implementation. For this reasons, slide shows have disadvantages: You spend a lot of time dragging arrows and boxes. This time would be better spend in thinking about why and where to move your arrows and boxes.
In addition, software that intermingles concept and representation typically is a vendor lock: You cannot (easily) get out if you find some more useful softare.
That’s why flowcharts and similar charts are usefully expressd in text. Then there should be some simple software which renders such proces descriptions into nice graphs.
Mermaid
Mermaid is a nice little tool for drawing diagrams such as flowcharts.
Mermaid via R
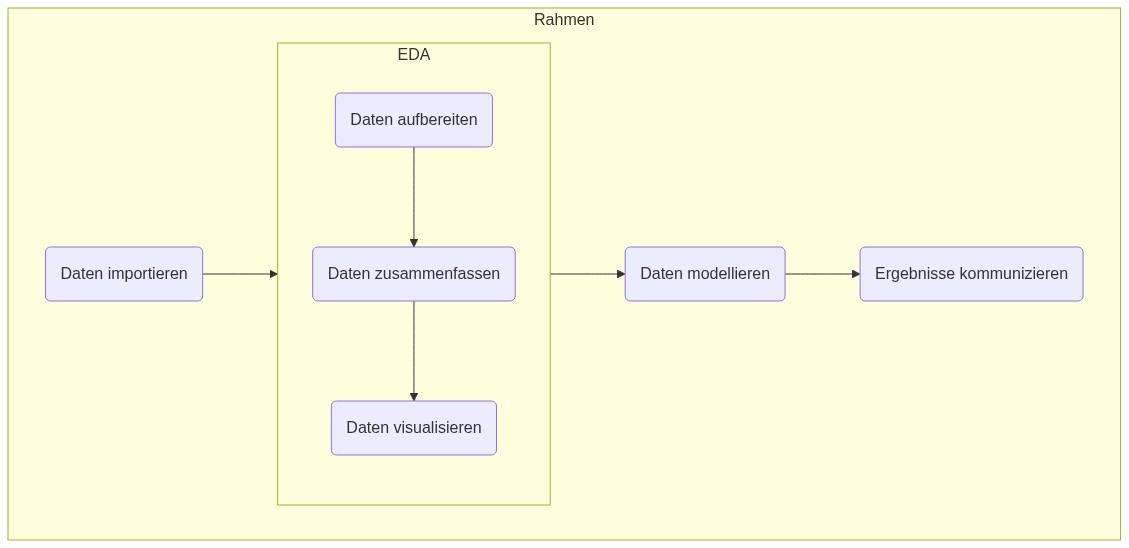
mermaid1 <-
  "flowchart LR
  subgraph id1 [Rahmen]
    direction LR
    import(Daten einlesen)
    subgraph eda [EDA]
      direction TB
      cleanse(Daten aufbereiten) --> sum
      sum(Daten zusammenfassen) --> vis(Daten visualisieren)
    end
  import(Daten importieren) --> eda
  eda --> mo(Daten modellieren)
  mo --> report(Ergebnisse kommunizieren)
end
"
Now let’s render:
mermaid(mermaid1)Unfortunately, the R version does not support all the types of graphs which are supported by this implmenentation.
It appears that the following features are not supported by the R version:
- flowcharts
- subgraphs
- connecting subgraphs with arrows
Thus, let’s go for this reduced version:
mermaid2 <-
  "graph LR
    import(Daten einlesen)
    cleanse(Daten aufbereiten) --> sum
    sum(Daten zusammenfassen) --> vis(Daten visualisieren)
  import(Daten importieren) --> cleanse
  vis --> mo(Daten modellieren)
mo --> report(Ergebnisse kommunizieren)"mermaid(mermaid2)From website
After having entered the source code on the live editor, we get back a markdown image link, pointing to the resource. Very comfortable. Of course, it is also possible to download an image file (png, jpg).