Background
Some musing on the collider bias.
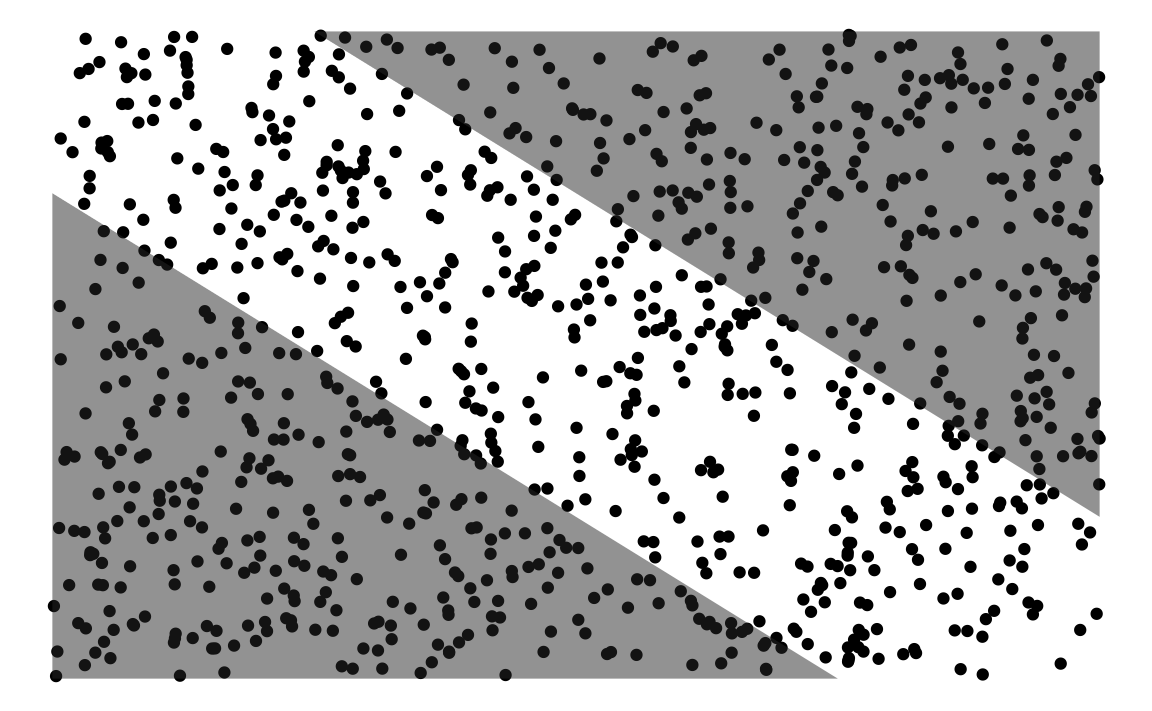
Let’s try to reverse engineer this image

Setup
library(tidyverse)
library(ggdag)
Simulate some data
n <- 1000
d <- tibble(
  x = rnorm(n, mean = 0, sd = 1),
  y = rnorm(n, mean = 0, sd = 1),
  e = rnorm(n, mean = 0, sd = 0.3),
  z = abs(x) * abs(y))
d: Uncorrelated data
The farer from the centroid the lighter the color.
ggplot(d) +
  aes(x = x,
      y = y,
      color = z) +
  geom_point() +
  scale_color_viridis_c()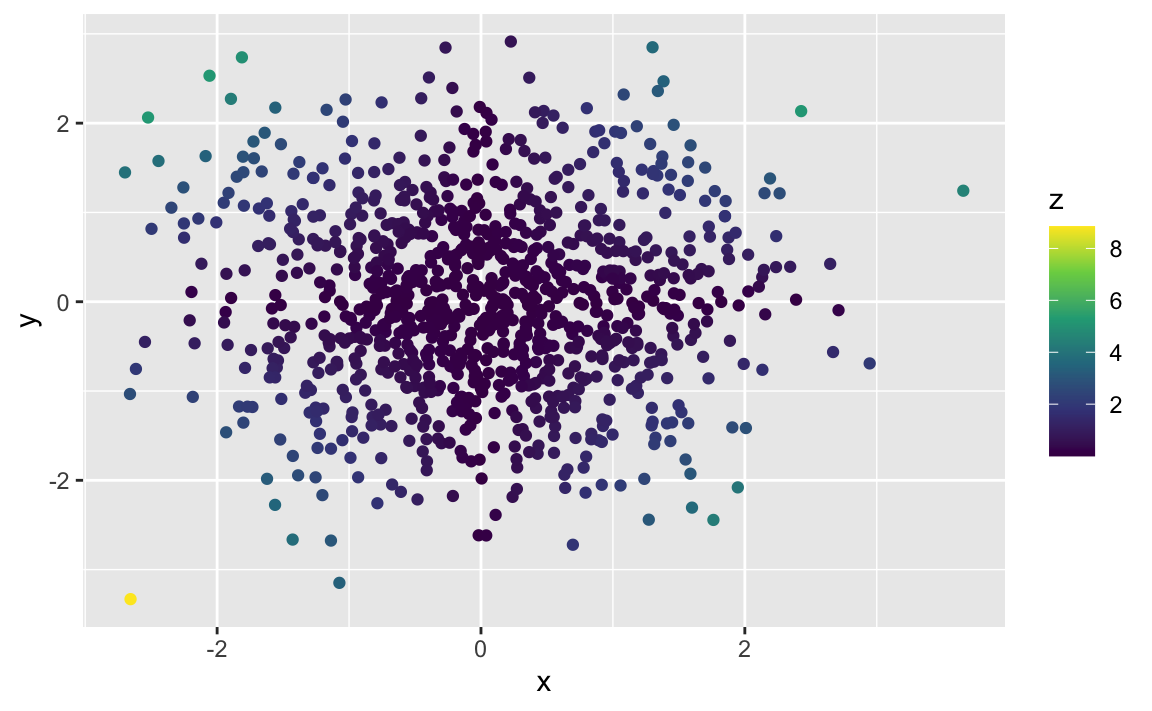
d2: vertical lines
d2 <- tibble(
  x = runif(n),
  y = runif(n),
  e = rnorm(n, mean = 0, sd = 0.3),
  z = abs(x) * abs(y)
)
Here we have the vertical line looked for, but it’s not symmetrical.
ggplot(d2) +
  aes(x = x,
      y = y,
      color = z) +
  geom_point() +
  scale_color_viridis_c()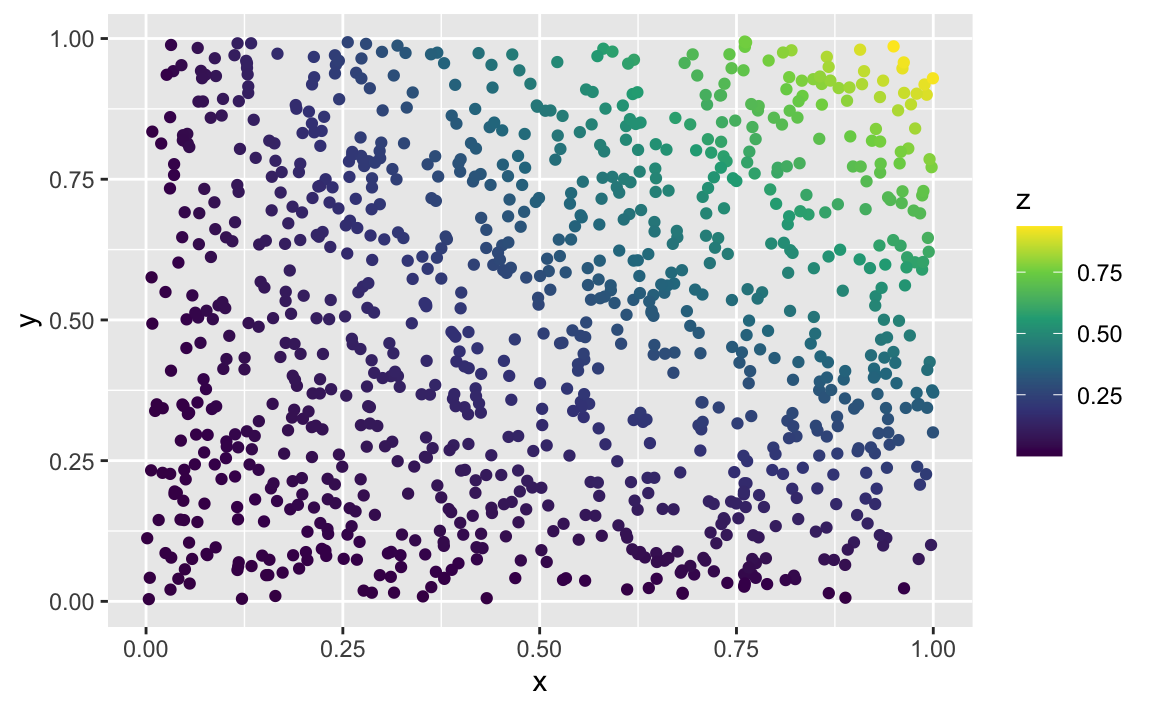
Circle line
d3 <- tibble(
  x = rnorm(n),
  y = rnorm(n)
)
d3 <-
d3 %>%
mutate(status = case_when(
sqrt(x^2 + y^2) > 1.4 ~ TRUE,
TRUE ~ FALSE
))d3 %>%
ggplot() +
aes(x = x,
y = y,
color = status) +
geom_point()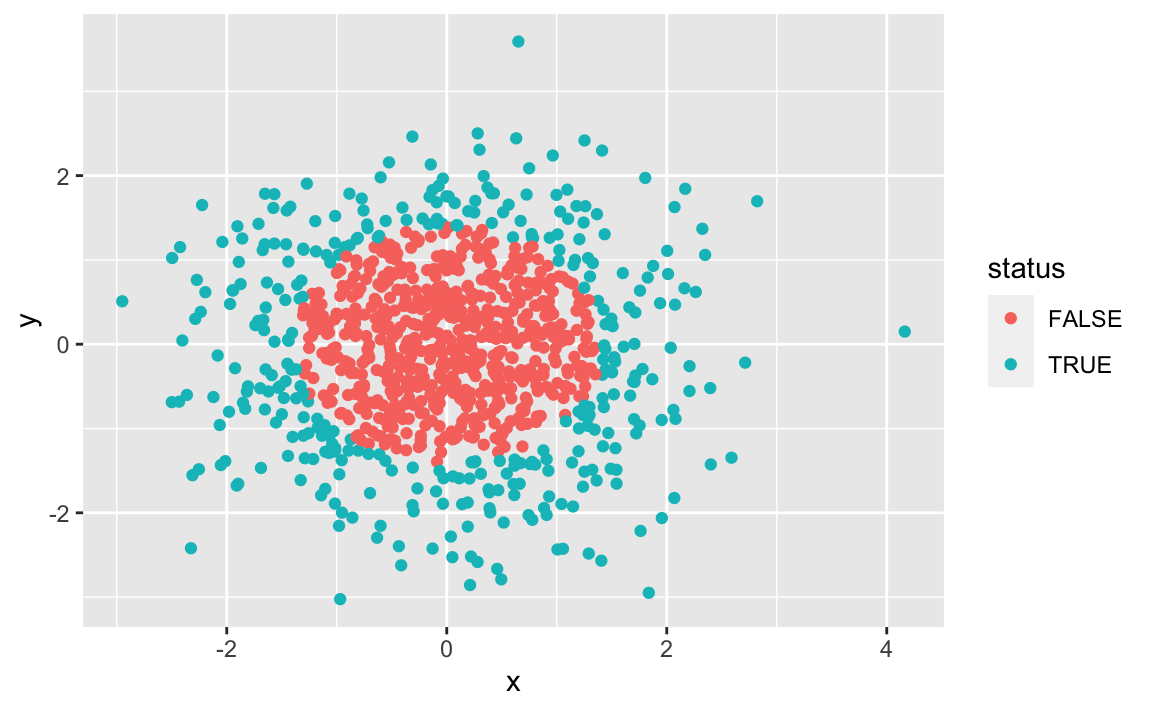
Put a triangle on random data
polygon_df <- tibble(
  x = c(0, 0, 0.75),
  y = c(0, 0.75, 0)
)
polygon_df2 <- tibble(
  x = c(0.25, 1, 1),
  y = c(1, 1, .25)
)
ggplot(d2) +
aes(x = x,
y = y) +
geom_point() +
scale_color_viridis_c() +
geom_polygon(data = polygon_df, alpha = .5) +
geom_polygon(data = polygon_df2, alpha = .5) +
theme_void()
Compute a function for the two linear borders
myf <- function(x) -x+0.75

myf2 <- function(x) -x + 1.25
d2 <- tibble(
x = runif(n),
y = runif(n),
status = case_when(
y > myf(x) & y < myf2(x) ~ TRUE,
TRUE ~ FALSE
)
)d2 %>%
ggplot() +
aes(x = x,
y = y,
color = status) +
geom_point() +
scale_color_manual(values = c("grey80", "black")) +
theme_bw() +
labs(x = "Looks",
y = "Talent") +
theme(legend.position = "bottom",
axis.text = element_blank())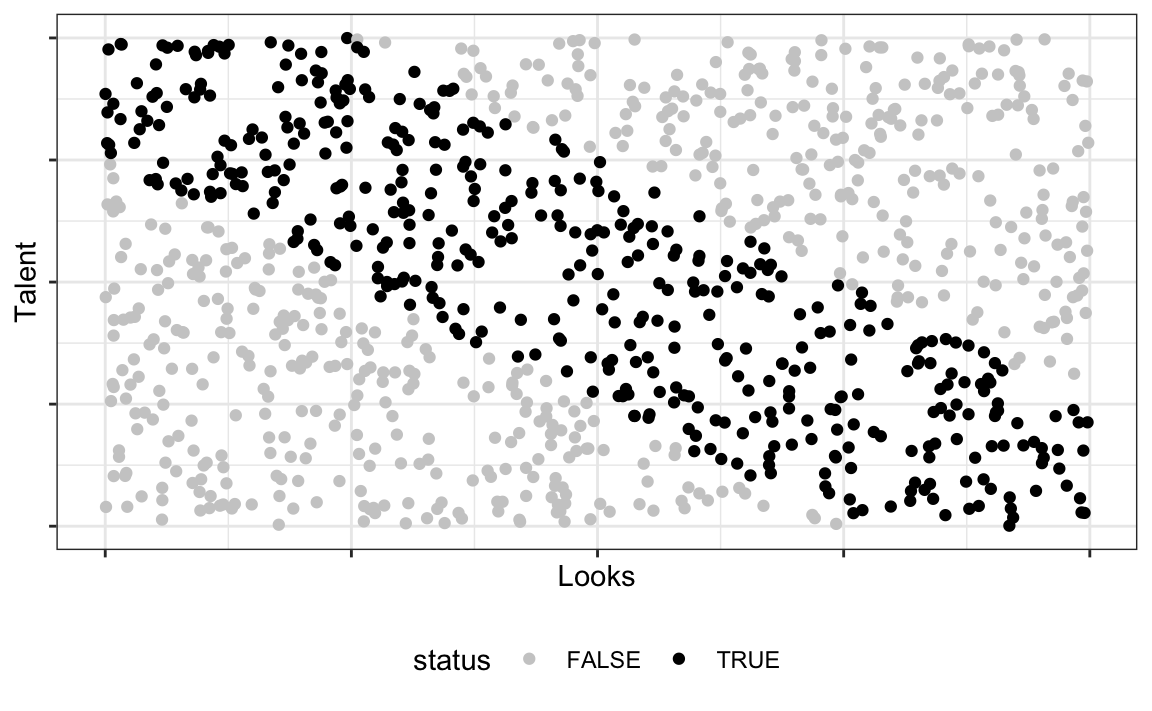
Here’s how the data look without the “filter” of status:
d2 %>%
  ggplot() +
  aes(x  = x,
      y = y) +
  geom_point() +
 # scale_color_manual(values = c("grey80", "black")) +
  theme_bw() +
  labs(x = "Looks",
       y = "Talent") +
    theme(legend.position = "bottom",
          axis.text = element_blank())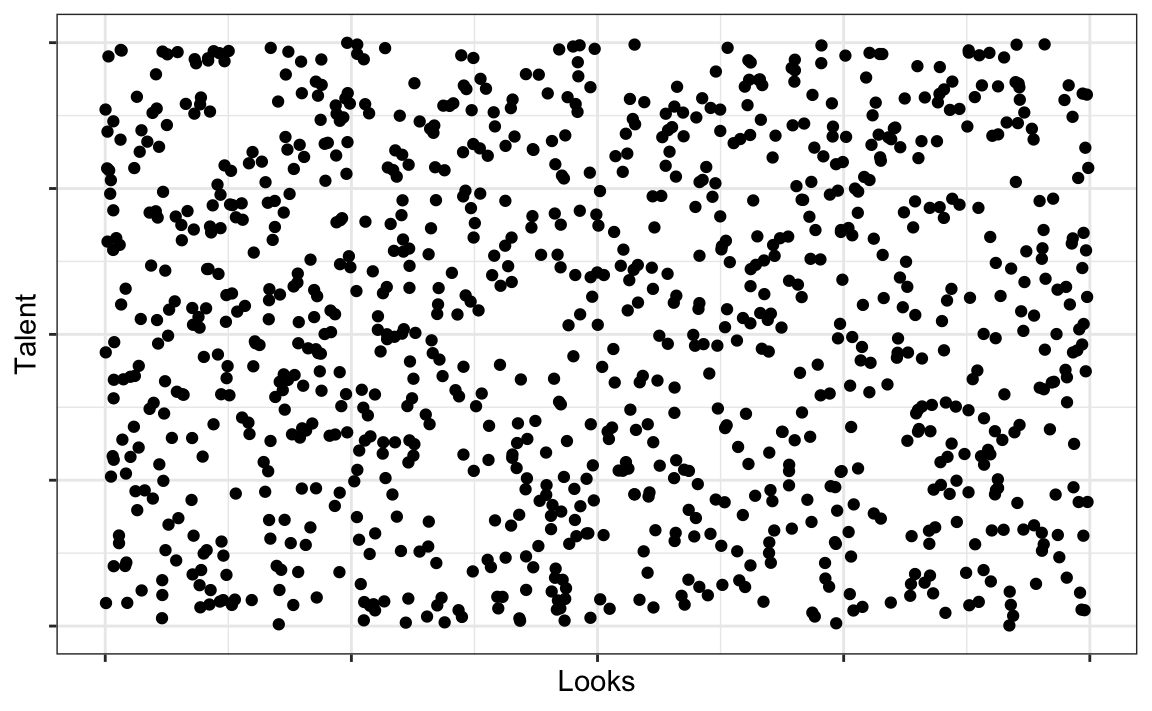
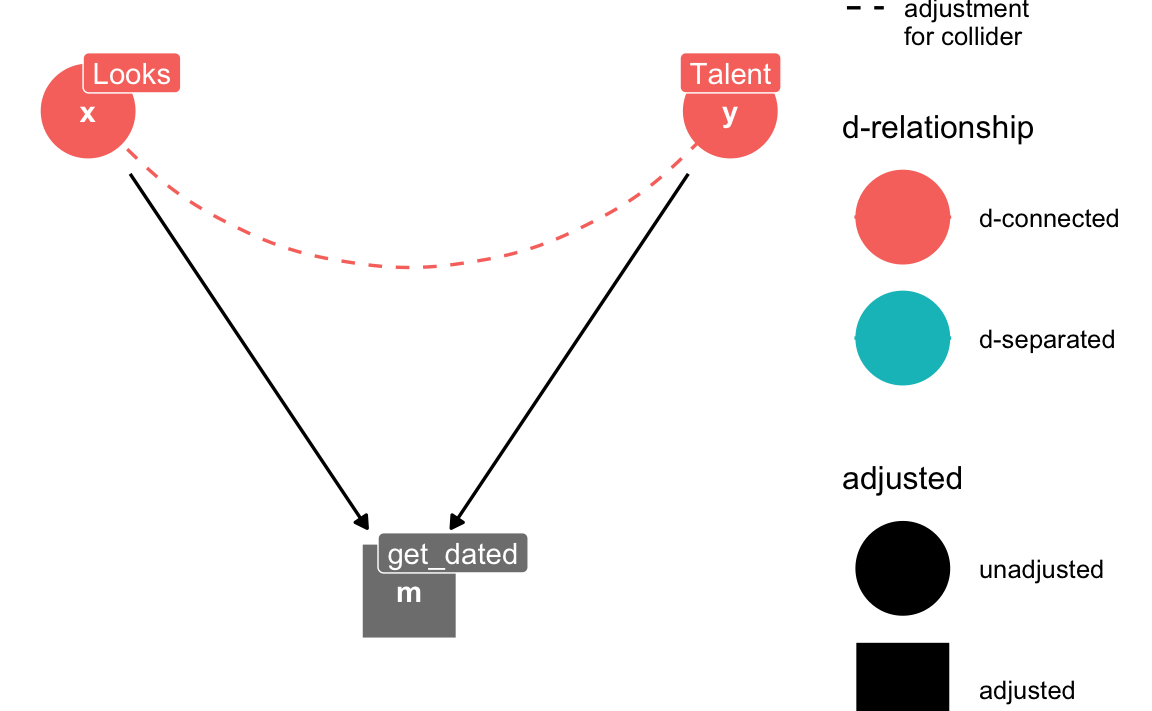
Collider triangle
collider_triangle(x = "Looks",
                  y = "Talent",
                  m = "get_dated") %>%
  ggdag_dseparated(controlling_for = "m",
                   text = TRUE,
                   use_labels = "label") +
  theme_dag()