Load packages
library(tidyverse)
#remotes::install_github("grantmcdermott/parttree")
library(parttree)
library(rpart)
library(rpart.plot)
library(parsnip)
library(titanic)
library(tidyverse)
Train learner
Build the tree using parsnip with rpart as the model engine:
set.seed(123)

titanic_train$Survived = as.factor(titanic_train$Survived)


ti_tree =
  decision_tree() %>%
  set_engine("rpart") %>%
  set_mode("classification") %>%
  fit(Survived ~ Pclass + Age, data = titanic_train)
Plot the model partitions
titanic_train %>%
  ggplot(aes(x=Pclass, y=Age)) +
  geom_jitter(aes(col=Survived), alpha=0.7) +
  geom_parttree(data = ti_tree,
                aes(fill=Survived), alpha = 0.1) +
  theme_minimal()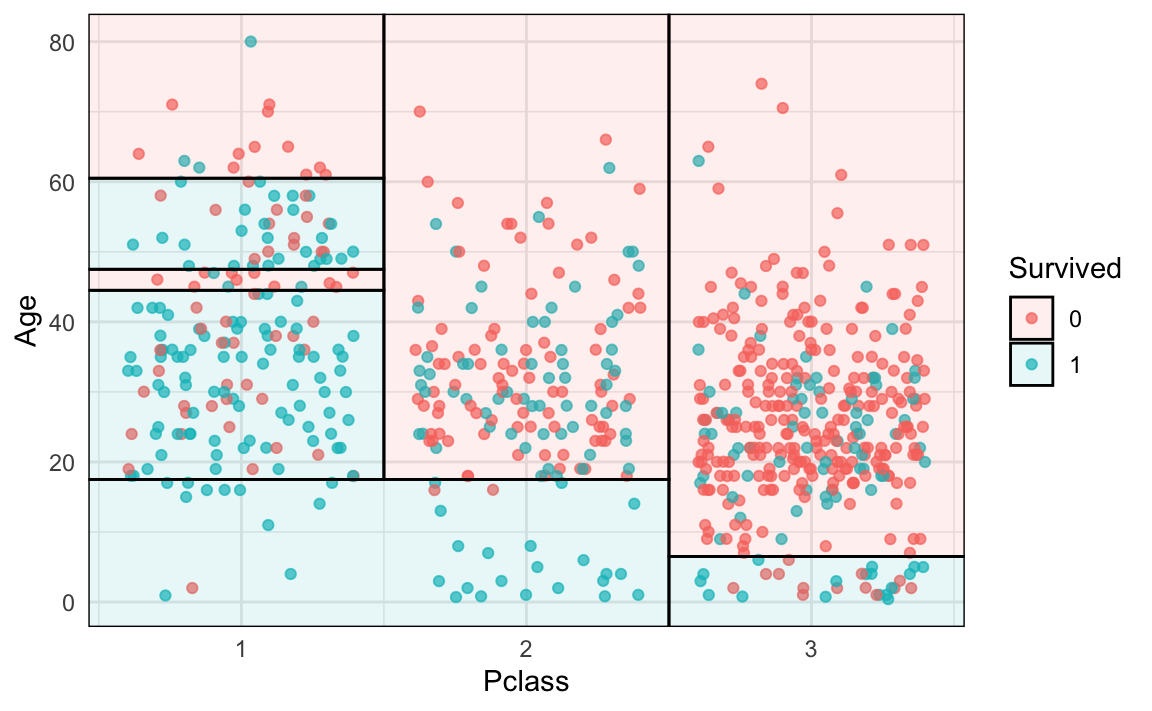
Plot the tree
rpart.plot(ti_tree[["fit"]],
           box.palette="RdBu",
           shadow.col="gray",
           nn=TRUE)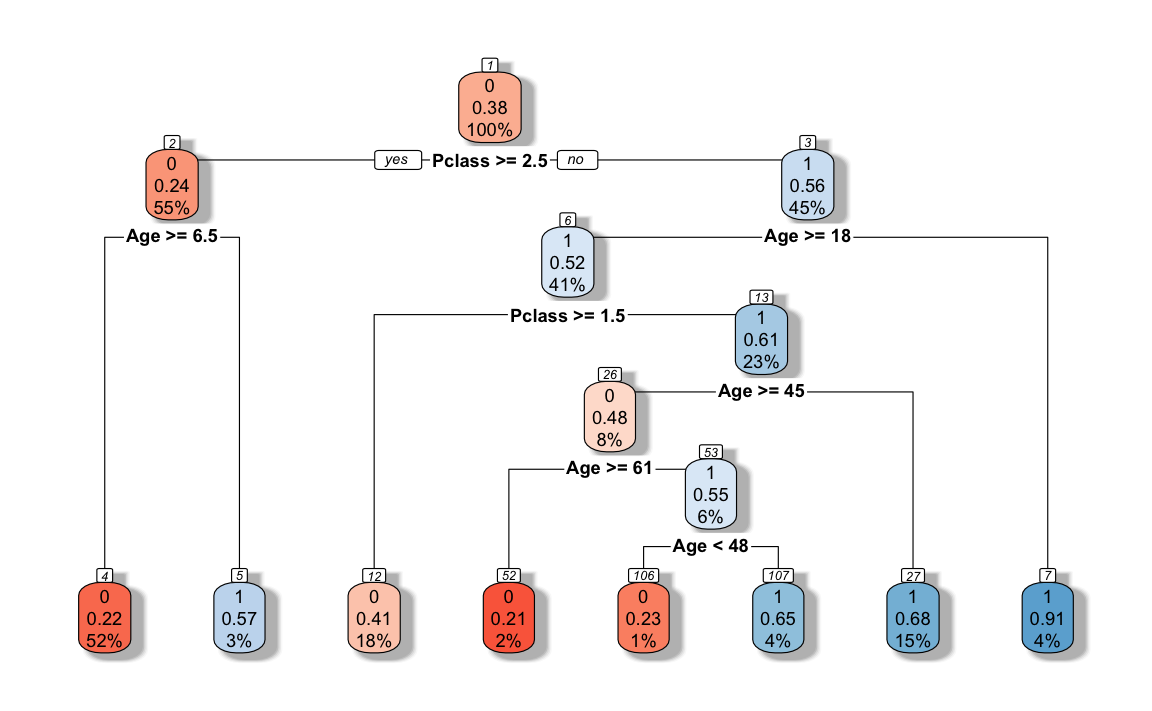
Sources
The recursive partitioning plot was designed by Grant McDermott. The tree plot is from the rpart.plot package written by Stephen Milborrow.