Load packages
library(tidyverse)
library(mosaic)
require(scales)
library(directlabels)
library(ggrepel)
library(ggthemes)
library(hrbrthemes)

options(scipen = 8)
Covid-19 growth rate
We are in the decline midst wake onset SOMEHWERE in the Corona crisis. A lot of hasty more or less useful research is being conducted.
One of the circulating claims is: “There Corona growth rate in country X is higher than in country Y!”
Let’s assume some doubling (growth) rate:
double_rates <- 5
double_rate_chosen <- 5 # sample(double_rates, size = 1)
Two countries with equal Covid-19 growth rate
Consider two countries, A und B, with the same Covid-19 growth rate. Let’s assume the doubling rate amounts to double_rate_chosen which is 5. In other words, the number of cases doubles after this number of days. For the sake of simplicity, let’s stick to this simple model for the purpose of the following argument.
Here are two countries, A and B, one small (A), and one larger (B).
s_a <- 1e04
s_b <- 1e06

s_a
#> [1] 10000
s_b
#> [1] 1000000
See the growth process in this diagram (both countries):

Relative vs. absolute case numbers
Some press releases talk about about the relative case number (\(n_{rel}\)), instead of the absolute case numbers (\(n_{abs}\)), see the discussion here.
To arrive at the relative case number, the absolute case number is divided by the population size \(s\):
\[n_{rel} = n_{abs}/s\].
The relative number is shown in the following figure:
d <- d %>%
  mutate(n_rel_a = cases/s_a,
         n_rel_b = cases/s_a) %>%
  mutate(pop_a = n_rel_a,
         pop_b = n_rel_b,
         pop_a_jit = pop_a + pop_a*.1,
         pop_b_jit = pop_b + pop_b*.1)

d_long <- d %>%
  pivot_longer(cols = c(pop_a_jit, pop_b_jit),
               names_to = "population",
               values_to = "rel_size")


ggplot(d_long) +
  aes(x = days, y = rel_size, color = population) +
  geom_line(size = 2, alpha = .4) +
  scale_y_continuous(labels = scales::comma) +
  scale_color_colorblind() +
  labs(x = "Days", "proportion of cases") +
  theme_ipsum_rc()
As can (not) be seen: the two curves lie exactly on each other. They are (practically) identical.
What the heck?!
Surprisingly, we see that the larger country (the population size being higher), ie., \(s_A > s_B\), shows a lower growth rate! The less steep curve appears to imply this conclusion.
However, this is not entirely correct.
Of course, the growth rates are equal, by definition, see above. The danger is that someone might claim “See the flat curve. In our country we are much better off. The warnings are exagerated!” Such a claim would be ill advised, as the (absolute) growth rates are in fact identical. T
Now what?
To better conceive the differences, one could make use of a logarithmic Y axis:
gf_line(n_rel_a ~ days, data = d, color = "blue") %>%
  gf_line(n_rel_b ~ days, color = "red") %>%
  gf_labs(x = "days", y = "LOG2 proportion of cases") +
  scale_y_continuous(labels = scales::comma, trans = "log2")  +
  theme_ipsum_rc()
Another solutions consists of calibrating the curves such that they start not showing the first cases, but rather that they start with the day of equal proportion of cases. Then the curves show again the different trajectories.
d <- d %>%
  mutate (n_rel_b_later =  2^((1/double_rate_chosen)*days+3.3) / s_b)


gf_line(n_rel_a ~ days, data = d, color = "blue") %>%
  gf_line(n_rel_b_later ~ days, color = "red") %>%
  gf_labs(x = "days since p=1/1e05 cases",
          y = "proportion cases") +
  scale_y_continuous(labels = scales::comma)  +
  theme_ipsum_rc()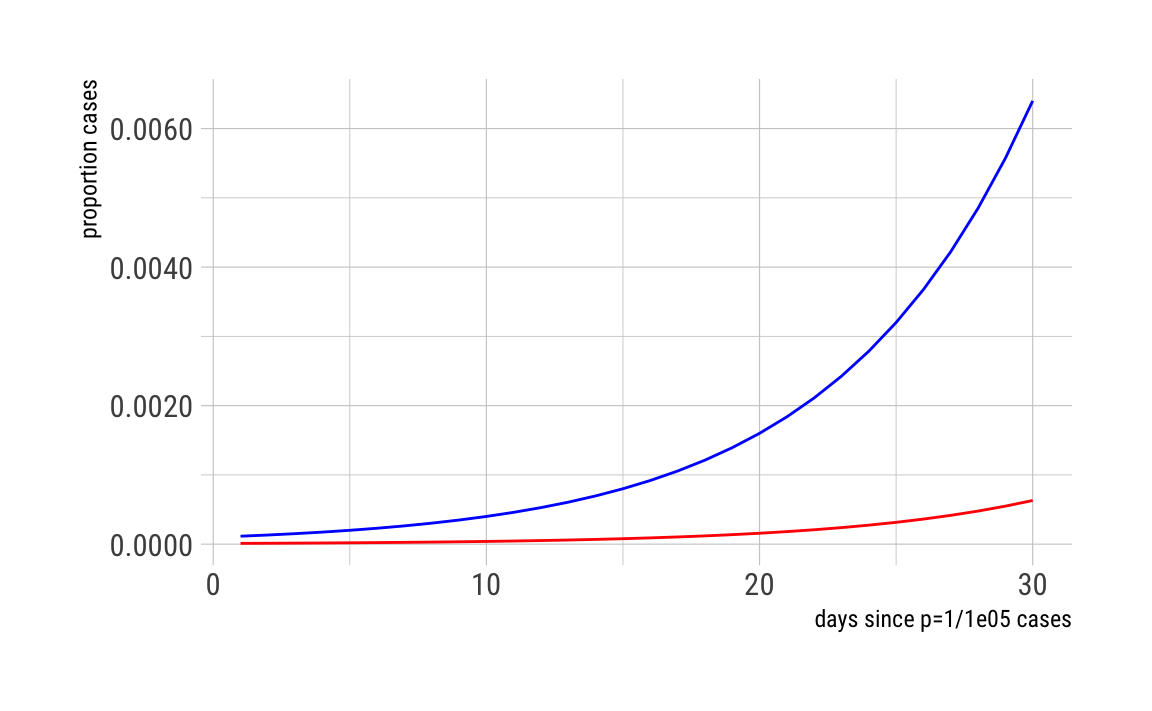
When to use relative cases?
There are situations when using the relative case number pays off. That’s when we are trying to compare the health-system burden. For example, a country where 90% ICU units are in use faces a higher burden than a country where 1% ICU units are in use. Similarly, a higher proportion of cases presents a higher societal burden. Modelling that burden would profit from comparing relative numbers.
A intuitive approach: Of cheese and mice
Consider two rooms, in each room there’s a nice piece of cheese. Yes, cheese. Now a mouse comes to each room, eating away some part of the cheese. Now, in which case would you claim a worse infestation with vermin?

cheese and mice
We would say that B is the more severe case, as the mice have eaten away more cheese. We would not argue for A; in A the proportion is higher, but normally we would care about the real, that is absolute harm done.