Load packages
library(tidyverse)
library(mosaic)
library(plotly)
Gimme a function
Say, you have some function such as
\[ f(x) = x^2+z^2 \]
In more R-ish:
f <- makeFun(x^2 + z^2 ~ x & z)And you would like to plot it.
Observe that this function has two input (independent) variables, \(x\) and \(z\), plus one output (dependent) variables, \(y\).
The thing is, you’ll need to define the values for a number of output values for \(y\), as defined by the function.
Define a grid
First, we define a grid for the input variables.
x <- y <- seq(-5, 5, length = 20)Compute the function value for each combination of the input variables
Then we compute the \(y\) value for each combination of \(x\) and \(y\), this can be achieved using outer(). That function applies some function on each combination of \(x\) and \(y\), and that’s just what we would like to achieve.
z <- outer(x,y, FUN = f)Plot in Base R
Now, let’s plot:
persp(x, y, z)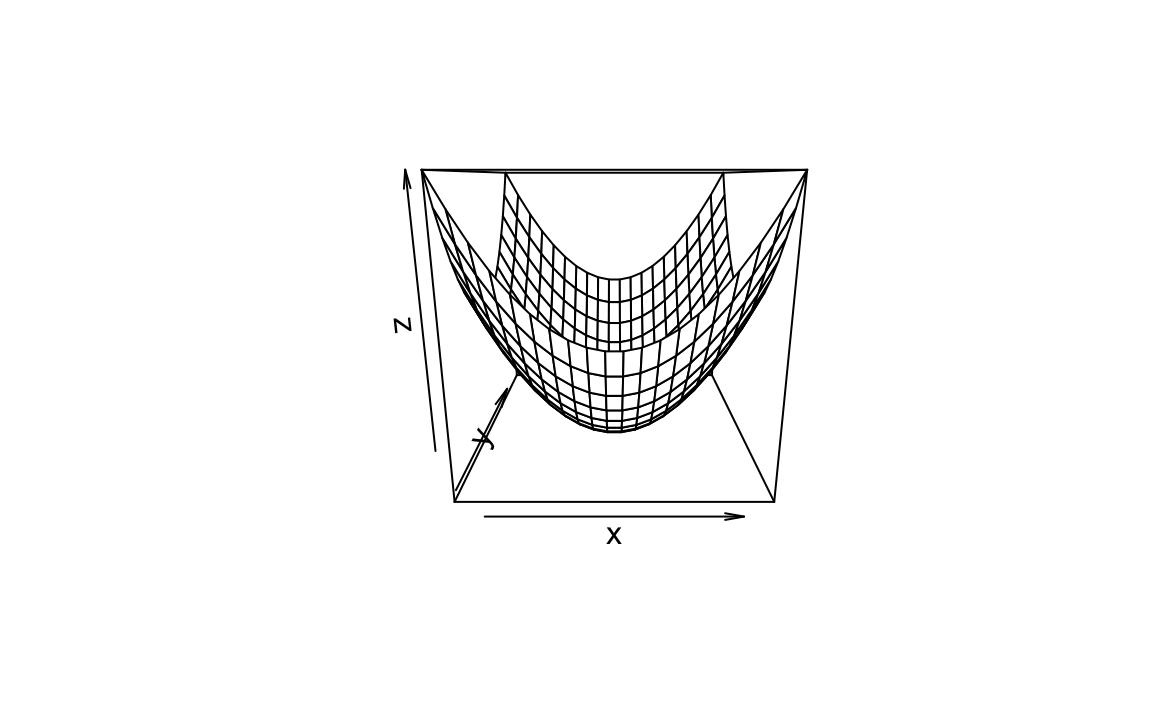
Plot using Plotly
plot_ly(x = x, y = y, z = z, type = "surface")Bonus: Contour plot in plotly
plot_ly(x = x, y = y, z = z, type = "contour")