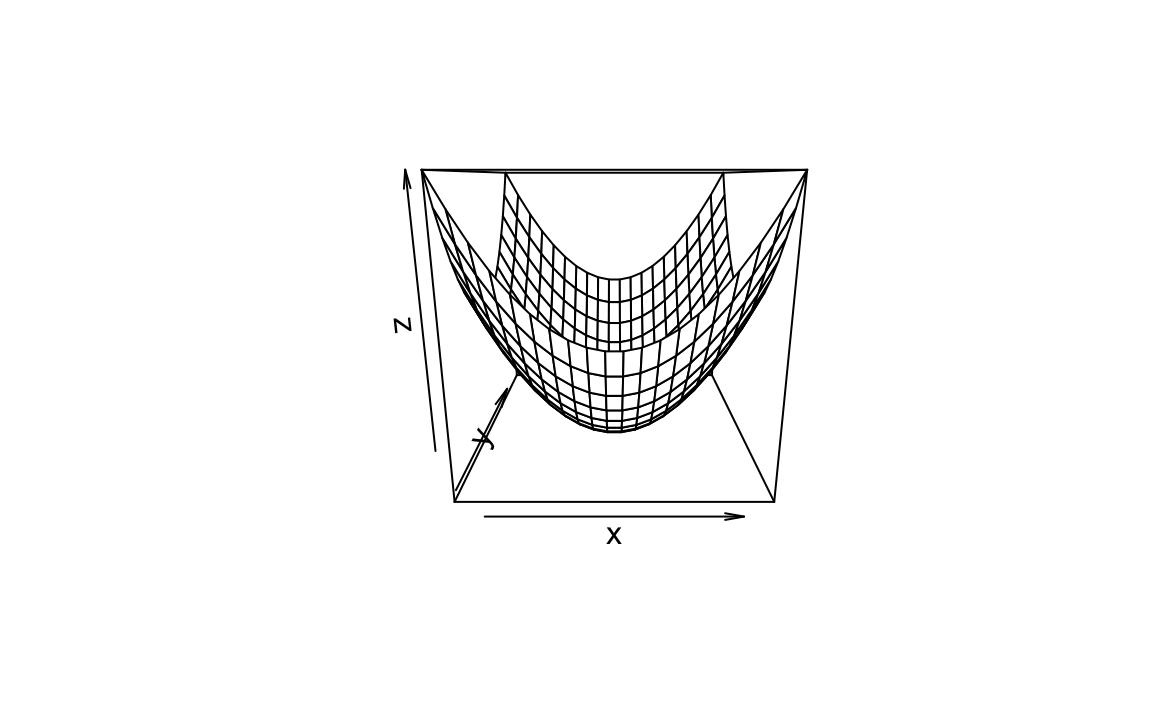
Observe that this function has two input (independent) variables, x and z, plus one output (dependent) variables, y.
The thing is, you’ll need to define the values for a number of output values for y, as defined by the function.
Define a grid
First, we define a grid for the input variables.
x <- y <- seq(-5, 5, length = 20)
Compute the function value for each combination of the input variables
Then we compute the y value for each combination of x and y, this can be achieved using outer(). That function applies some function on each combination of x and y, and that’s just what we would like to achieve.