Load packages
library(tidyverse)
library(MASS)
Motivation
It is well-known that the notorious (Pearson’s) correlation cannot exceed an absolute value greater than 1, that is
−1≤r≤+1
or
|r|≤1
However, proofing this fact is less straightforward. A classical way of proofing the above inequality is by using the Cauchy-Schwarz inequality. From a teacher’s perspective, the CS inequality may not be ideal, because the students may lack some knowledge necessary for appreciating this proof. In order to provide teachers’s (or anyone else for that matter), this posts provides an alternative way, one that does not demand much more than basic algebra and some knowledge about descriptive statistics (particularly including z-scores and correlation). This posts builds on this paper.
Definitions
Assume there are two sets of measurements (values), where xi and yi denote the i measurement, i=1,2,…,n. The (empirical) correlation r can then be defined as
rxy=r=sxysxsy
where sx denotes the standard deviation of X, and sxy the covariancee of x and y.
Let’s denote xi−ˉx with dxi (and dyi in the obvious way).
Note the analoguous definition of s2x and sxy:
s2x=1n∑dx2i=1n∑(dxi⋅dxi)sxy=1n∑(dxi⋅dyi)
Hence
√s2x⋅s2y=sxy
In other words: The variance sx=1n∑(dxi⋅dxi) equals the covariance if we let the second dxi equal dyi.
sxsy=√1n∑(dxi)2⋅1n∑(dyi)2=1n∑(dxi⋅dyi)
As the z-score is defined as
z=xi−ˉxsx
we may also define r as
r=1n∑(zx⋅zy)
Intuition about the magnitude or r
Let’s simulate some correlated data.
d <- mvrnorm(n = 100, mu = c(0,0) , Sigma = matrix(c(1, 0.7, 0.7, 1), nrow = 2), empirical = TRUE)

d <- as_tibble(d)
Let’s color the dots with respect of the sign of the product of V1 and V2.
d <- d %>%
  mutate(dot_sign = ifelse(V1*V2 > 0, "pos", "neg"))
ggplot(d, aes(V1, V2, color = dot_sign)) +
geom_point() +
geom_vline(xintercept = mean(d$V1), linetype = "dashed") +
geom_hline(yintercept = mean(d$V1), linetype = "dashed")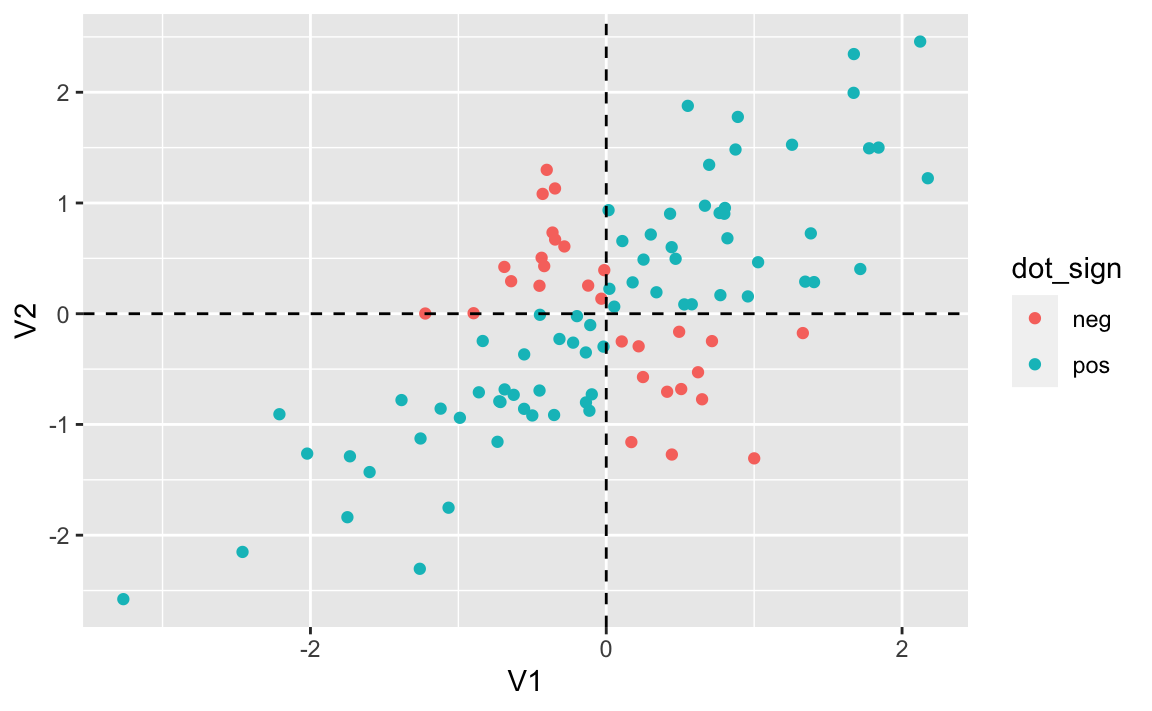
We see four “regions”, two with positive and two with negative sign.
Observe that in the two “positive” regions the product of V1 and V2 is positive, and in the two negative regions, their product is negative.
Some properties of z-scores and their sums and products
Further note that - as squares cannot be negative - this term must be nonnegative:
(zxi+zyi)2
for each i.
Similarly,
1n∑(zxi+zyi)2≥0eq. 3
Read the above equation as “the average squared sum of two z-scores must be nonnegative.”
Now multiply out the binomial part of the last step:
1n∑[z2x+2zxzy+z2y]≥01n∑z2x+21n∑zxzy+1n∑z2y≥0Note that 1n∑z2=11+2rxy+1≥02+2rxy≥0rxy≥−1
If we change the plus sign in eq. 3 into a minus sign, we get rxy≤1. In sum:
−1≤rxy≤+1
Hence, we have found that the r cannot exceed an absolute values of 1.