Packages
We will need the following packages in this post:
library(mosaic)
library(knitr)
library(DT)
The OECD wellbeing study series
The OECD keeps measuring the wellbeing (and associated variables) among its members states.
On the project website, the OECD states:
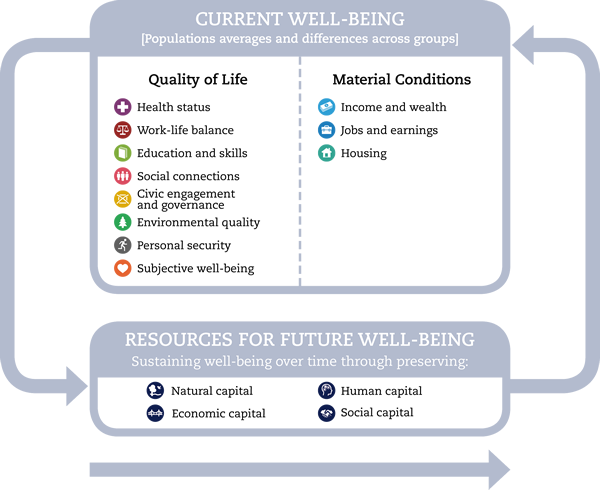
In recent years, concerns have emerged regarding the fact that macro-economic statistics, such as GDP, don’t provide a sufficiently detailed picture of the living conditions that ordinary people experience. While these concerns were already evident during the years of strong growth and good economic performance that characterised the early part of the decade, the financial and economic crisis has further amplified them. Addressing these perceptions is of crucial importance for the credibility and accountability of public policies but also for the very functioning of democracy. Societal progress is about improvements in the well-being of people and households. Assessing such progress requires looking not only at the functioning of the economic system but also at the diverse experiences and living conditions of people. The OECD Framework for Measuring Well-Being and Progress shown below is based on the recommendations made in 2009 by the Commission on the Measurement of Economic Performance and Social Progress to which the OECD contributed significantly. It also reflects earlier OECD work and various national initiatives in the field. This Framework is built around three distinct domains: material conditions, quality of life and sustainability, each with their relevant dimensions.
Data access and terms
Data can be accessed eg., via this link.
This is the doi: https://doi.org/10.1787/data-00707-en (there’s a reference manager export option available).
Terms can be read here.
Import into R
To import the data into R, follow this appraoch:
- Download the data
- Save the data file in a folder where the Rmd-file (or R-script-file) resides
- Add the following line to your script:
oecd <- read.csv("oecd-wellbeing.csv")Notice that the file name, here oecd-wellbegin.csv need to be changed according to the file name you have chosen.
First glimpse
inspect(oecd)
#>
#> categorical variables:
#>          name     class levels   n missing
#> 1     Country character     35 429       0
#> 2      Region character    427 429       0
#> 3 region_type character      2 429       0
#> 4        Code character    429 429       0
#>                                    distribution
#> 1 United States (12.1%), Mexico (7.7%) ...
#> 2 Luxembourg (0.5%), Mexico (0.5%) ...
#> 3 country_part (92.1%) ...
#> 4 AT11 (0.2%), AT12 (0.2%) ...
#>
#> quantitative variables:
#>                        name   class min    Q1 median  Q3 max     mean       sd
#> 1                 Education numeric   0 5.525    7.9 9.0  10 6.811972 2.968513
#> 2                      Jobs numeric   0 5.200    6.9 8.1  10 6.450350 2.407170
#> 3                    Income numeric   0 2.000    4.1 5.4  10 4.106993 2.699757
#> 4                    Safety numeric   0 5.700    8.3 9.5  10 7.049650 3.228861
#> 5                    Health numeric   0 3.100    6.3 8.2  10 5.726340 2.927557
#> 6               Environment numeric   0 3.200    5.5 7.5  10 5.400699 2.734365
#> 7          Civic_engagement numeric   0 3.100    5.0 7.2  10 5.054312 2.848784
#> 8  Accessiblity_to_services numeric   0 5.700    7.2 8.3  10 6.527040 2.645392
#> 9                   Housing numeric   0 1.700    5.0 7.2  10 4.796721 3.024460
#> 10                Community numeric   0 5.600    7.8 8.8  10 6.875765 2.746413
#> 11        Life_satisfaction numeric   0 3.700    6.3 8.5  10 5.799765 2.895454
#>      n missing
#> 1  426       3
#> 2  429       0
#> 3  429       0
#> 4  429       0
#> 5  429       0
#> 6  429       0
#> 7  429       0
#> 8  429       0
#> 9  427       2
#> 10 425       4
#> 11 425       4
Let’s print it as a nice table, but only the first couple of lines:
oecd %>%
  head() %>%
kable()| Country | Region | region_type | Code | Education | Jobs | Income | Safety | Health | Environment | Civic_engagement | Accessiblity_to_services | Housing | Community | Life_satisfaction |
|---|---|---|---|---|---|---|---|---|---|---|---|---|---|---|
| Australia | New South Wales | country_part | AU1 | 8.0 | 8.1 | 6.8 | 8.8 | 9.0 | 9.8 | 10 | 7.2 | 7.2 | 8.9 | 7.8 |
| Australia | Victoria | country_part | AU2 | 8.1 | 7.9 | 5.9 | 9.5 | 9.5 | 8.6 | 10 | 7.5 | 7.8 | 9.3 | 8.5 |
| Australia | Queensland | country_part | AU3 | 7.8 | 8.1 | 6.3 | 9.5 | 8.3 | 9.9 | 10 | 7.7 | 8.3 | 8.6 | 8.1 |
| Australia | South Australia | country_part | AU4 | 7.3 | 7.8 | 6.1 | 9.0 | 8.5 | 9.4 | 10 | 7.2 | 8.3 | 8.6 | 8.5 |
| Australia | Western Australia | country_part | AU5 | 7.6 | 8.8 | 7.9 | 8.6 | 9.3 | 9.6 | 10 | 7.8 | 8.9 | 8.5 | 7.8 |
| Australia | Tasmania | country_part | AU6 | 6.5 | 7.6 | 5.4 | 8.8 | 5.4 | 10.0 | 10 | 6.8 | 8.3 | 8.6 | 9.6 |
Another option would be to use datatable::datatable() to print the data frame in html-only form, but in an interactive fashion.