One frequent use of the Shiny server software is displaying interactive data diagrams. The pro of using Shiny is the great flexibility; much more than “just graphics” can be done. Basically Shiny provides a flexible GUI for your R program. But if you simply aiming at displaying or exploring some data interactively, a much simplor approach may do it for you; there are some nice libraries available in R for that. The aim of this post is to present some examples, and to that’s easy to use them in R.
The point is that the computations necessary for interactivity are done by a JavaScript rendered by the browser, ie., on the local machine. No server reosources are needed. In addition, it appears to be a stable technology. Popular JS libraries which are connected with R included Leaflet, D3, among others. In fact, as of today, 92 JS libraries have been linked to the R library htmlwidgets.
As quite a bit of JS is computed in the background, this site may take a while to render.
library(tidyverse)## ── Attaching packages ────────────────────────────────────────────────────────────────────────────────────────────────────────────────── tidyverse 1.2.1 ──## ✔ ggplot2 3.0.0 ✔ purrr 0.2.5
## ✔ tibble 1.4.2 ✔ dplyr 0.7.6
## ✔ tidyr 0.8.1 ✔ stringr 1.3.1
## ✔ readr 1.1.1 ✔ forcats 0.3.0## Warning: package 'dplyr' was built under R version 3.5.1## ── Conflicts ───────────────────────────────────────────────────────────────────────────────────────────────────────────────────── tidyverse_conflicts() ──
## ✖ dplyr::filter() masks stats::filter()
## ✖ dplyr::lag() masks stats::lag()data(mtcars)
glimpse(mtcars)## Observations: 32
## Variables: 11
## $ mpg <dbl> 21.0, 21.0, 22.8, 21.4, 18.7, 18.1, 14.3, 24.4, 22.8, 19....
## $ cyl <dbl> 6, 6, 4, 6, 8, 6, 8, 4, 4, 6, 6, 8, 8, 8, 8, 8, 8, 4, 4, ...
## $ disp <dbl> 160.0, 160.0, 108.0, 258.0, 360.0, 225.0, 360.0, 146.7, 1...
## $ hp <dbl> 110, 110, 93, 110, 175, 105, 245, 62, 95, 123, 123, 180, ...
## $ drat <dbl> 3.90, 3.90, 3.85, 3.08, 3.15, 2.76, 3.21, 3.69, 3.92, 3.9...
## $ wt <dbl> 2.620, 2.875, 2.320, 3.215, 3.440, 3.460, 3.570, 3.190, 3...
## $ qsec <dbl> 16.46, 17.02, 18.61, 19.44, 17.02, 20.22, 15.84, 20.00, 2...
## $ vs <dbl> 0, 0, 1, 1, 0, 1, 0, 1, 1, 1, 1, 0, 0, 0, 0, 0, 0, 1, 1, ...
## $ am <dbl> 1, 1, 1, 0, 0, 0, 0, 0, 0, 0, 0, 0, 0, 0, 0, 0, 0, 1, 1, ...
## $ gear <dbl> 4, 4, 4, 3, 3, 3, 3, 4, 4, 4, 4, 3, 3, 3, 3, 3, 3, 4, 4, ...
## $ carb <dbl> 4, 4, 1, 1, 2, 1, 4, 2, 2, 4, 4, 3, 3, 3, 4, 4, 4, 1, 2, ...Mouseover
Highlighting values by hovering the mose over some plot area is a builtin feature in the respective libraries.
mtcars %>%
  ggplot() +
  aes(x  = factor(cyl), y = mpg, color = factor(cyl)) +
  geom_point(position = "jitter") -> p1
p1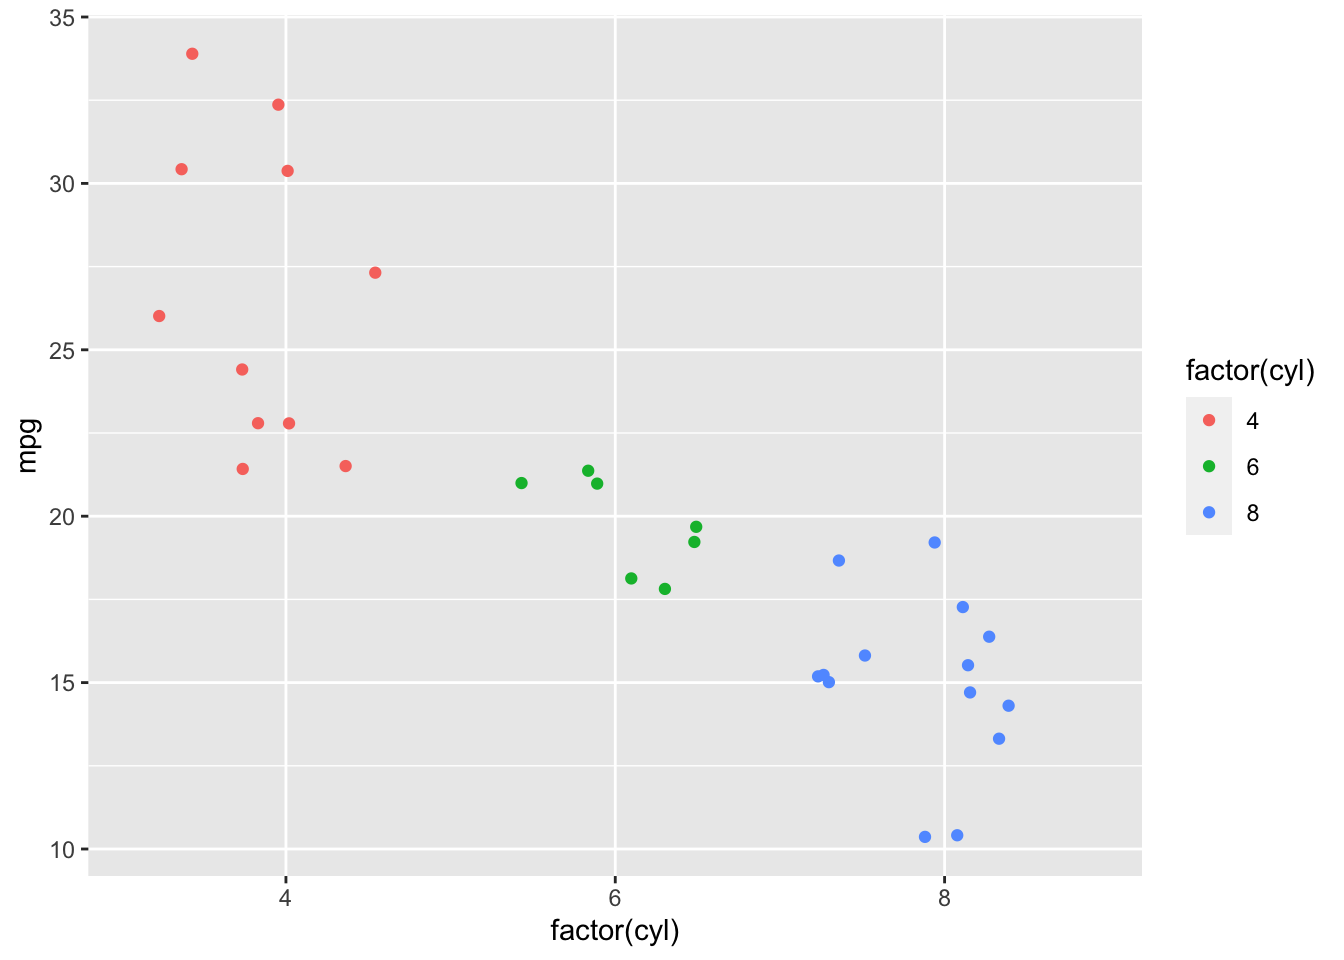
Introducing plotly:
library(plotly)##
## Attaching package: 'plotly'## The following object is masked from 'package:ggplot2':
##
## last_plot## The following object is masked from 'package:stats':
##
## filter## The following object is masked from 'package:graphics':
##
## layoutggplotly(p1)Say you want a plot where some data cats (group A vs. group B etc.) can be selected. Plotly supports that out of the box for subgroups; click on the cyl values in the legend of the plot above. Plotly does that out of the box. JavaScript inside.
BTW, zooming is also possible in Plotly.
Rbokeh
Rbokey is another JS library hooked to R. Subgrouping is not possibly, as far as I have seen in the first instant.
library(rbokeh)
figure() %>%
  ly_points(Sepal.Length, Sepal.Width, data = iris,
    color = Species, glyph = Species,
    hover = list(Sepal.Length, Sepal.Width))
## Warning in structure(x, class = unique(c("AsIs", oldClass(x)))): Calling 'structure(NULL, *)' is deprecated, as NULL cannot have attributes.
## Consider 'structure(list(), *)' instead.
## Warning in structure(x, class = unique(c("AsIs", oldClass(x)))): Calling 'structure(NULL, *)' is deprecated, as NULL cannot have attributes.
##   Consider 'structure(list(), *)' instead.

## Warning in structure(x, class = unique(c("AsIs", oldClass(x)))): Calling 'structure(NULL, *)' is deprecated, as NULL cannot have attributes.
##   Consider 'structure(list(), *)' instead.

## Warning in structure(x, class = unique(c("AsIs", oldClass(x)))): Calling 'structure(NULL, *)' is deprecated, as NULL cannot have attributes.
##   Consider 'structure(list(), *)' instead.

## Warning in structure(x, class = unique(c("AsIs", oldClass(x)))): Calling 'structure(NULL, *)' is deprecated, as NULL cannot have attributes.
##   Consider 'structure(list(), *)' instead.

## Warning in structure(x, class = unique(c("AsIs", oldClass(x)))): Calling 'structure(NULL, *)' is deprecated, as NULL cannot have attributes.
##   Consider 'structure(list(), *)' instead.

## Warning in structure(x, class = unique(c("AsIs", oldClass(x)))): Calling 'structure(NULL, *)' is deprecated, as NULL cannot have attributes.
##   Consider 'structure(list(), *)' instead.

## Warning in structure(x, class = unique(c("AsIs", oldClass(x)))): Calling 'structure(NULL, *)' is deprecated, as NULL cannot have attributes.
##   Consider 'structure(list(), *)' instead.

## Warning in structure(x, class = unique(c("AsIs", oldClass(x)))): Calling 'structure(NULL, *)' is deprecated, as NULL cannot have attributes.
##   Consider 'structure(list(), *)' instead.
## Warning in structure(x, class = unique(c("AsIs", oldClass(x)))): Calling 'structure(NULL, *)' is deprecated, as NULL cannot have attributes.
## Consider 'structure(list(), *)' instead.
## Warning in structure(x, class = unique(c("AsIs", oldClass(x)))): Calling 'structure(NULL, *)' is deprecated, as NULL cannot have attributes.
## Consider 'structure(list(), *)' instead.
## Warning in structure(x, class = unique(c("AsIs", oldClass(x)))): Calling 'structure(NULL, *)' is deprecated, as NULL cannot have attributes.
## Consider 'structure(list(), *)' instead.Rbokeh allows for easy map plotting.
library(maps)##
## Attaching package: 'maps'## The following object is masked from 'package:purrr':
##
## mapdata(world.cities)
caps <- subset(world.cities, capital == 1)
caps$population <- prettyNum(caps$pop, big.mark = ",")
figure(width = 800, height = 450, padding_factor = 0) %>%
ly_map("world", col = "gray") %>%
ly_points(long, lat, data = caps, size = 5,
hover = c(name, country.etc, population))## Warning in structure(x, class = unique(c("AsIs", oldClass(x)))): Calling 'structure(NULL, *)' is deprecated, as NULL cannot have attributes.
## Consider 'structure(list(), *)' instead.
## Warning in structure(x, class = unique(c("AsIs", oldClass(x)))): Calling 'structure(NULL, *)' is deprecated, as NULL cannot have attributes.
## Consider 'structure(list(), *)' instead.
## Warning in structure(x, class = unique(c("AsIs", oldClass(x)))): Calling 'structure(NULL, *)' is deprecated, as NULL cannot have attributes.
## Consider 'structure(list(), *)' instead.
## Warning in structure(x, class = unique(c("AsIs", oldClass(x)))): Calling 'structure(NULL, *)' is deprecated, as NULL cannot have attributes.
## Consider 'structure(list(), *)' instead.
## Warning in structure(x, class = unique(c("AsIs", oldClass(x)))): Calling 'structure(NULL, *)' is deprecated, as NULL cannot have attributes.
## Consider 'structure(list(), *)' instead.
## Warning in structure(x, class = unique(c("AsIs", oldClass(x)))): Calling 'structure(NULL, *)' is deprecated, as NULL cannot have attributes.
## Consider 'structure(list(), *)' instead.
## Warning in structure(x, class = unique(c("AsIs", oldClass(x)))): Calling 'structure(NULL, *)' is deprecated, as NULL cannot have attributes.
## Consider 'structure(list(), *)' instead.
## Warning in structure(x, class = unique(c("AsIs", oldClass(x)))): Calling 'structure(NULL, *)' is deprecated, as NULL cannot have attributes.
## Consider 'structure(list(), *)' instead.A maps example, taken from this source.
Scatter3D
Scatter3D looks quite promising, too; eg., subdata cats are possible.
library(scatterD3)
mtcars$names <- rownames(mtcars)
scatterD3(data = mtcars, x = wt, y = mpg, lab = names,
          col_var = cyl, symbol_var = am,
          xlab = "Weight", ylab = "Mpg", col_lab = "Cylinders",
          symbol_lab = "Manual transmission")
pairsD3
This example is taken from here.
data(iris)
library(pairsD3)
pairsD3(iris[,1:4],group=iris[,5])
As it appears not to run in this environment, check out this example.
Here’s a static version:
static pairsD3
Radarchart
Consider this example, which does not show in this environment, but ran on my local machine.
library(radarchart)

labs <- c("Communicator", "Data Wangler", "Programmer",
          "Technologist",  "Modeller", "Visualizer")

scores <- list(
  "Rich" = c(9, 7, 4, 5, 3, 7),
  "Andy" = c(7, 6, 6, 2, 6, 9),
  "Aimee" = c(6, 5, 8, 4, 7, 6)
)

chartJSRadar(scores = scores, labs = labs, maxScale = 10)
Static version:

Static version
GoogleVis
GoogleVis is very versatile, too. Consider this example:
library(googleVis)## Creating a generic function for 'toJSON' from package 'jsonlite' in package 'googleVis'##
## Welcome to googleVis version 0.6.2
##
## Please read Google's Terms of Use
## before you start using the package:
## https://developers.google.com/terms/
##
## Note, the plot method of googleVis will by default use
## the standard browser to display its output.
##
## See the googleVis package vignettes for more details,
## or visit http://github.com/mages/googleVis.
##
## To suppress this message use:
## suppressPackageStartupMessages(library(googleVis))mtcars_cyl <- mtcars %>%
rownames_to_column() %>%
select(rowname, cyl, am) %>%
count(cyl, am) %>%
mutate(cyl = factor(cyl))
mtcars_bars <- gvisBarChart(mtcars_cyl)
plot(mtcars_bars)## starting httpd help server ...## doneThe different bars can be selected and highlighted.
Many more plot types are available.
More
More examples and libraries can be found here.