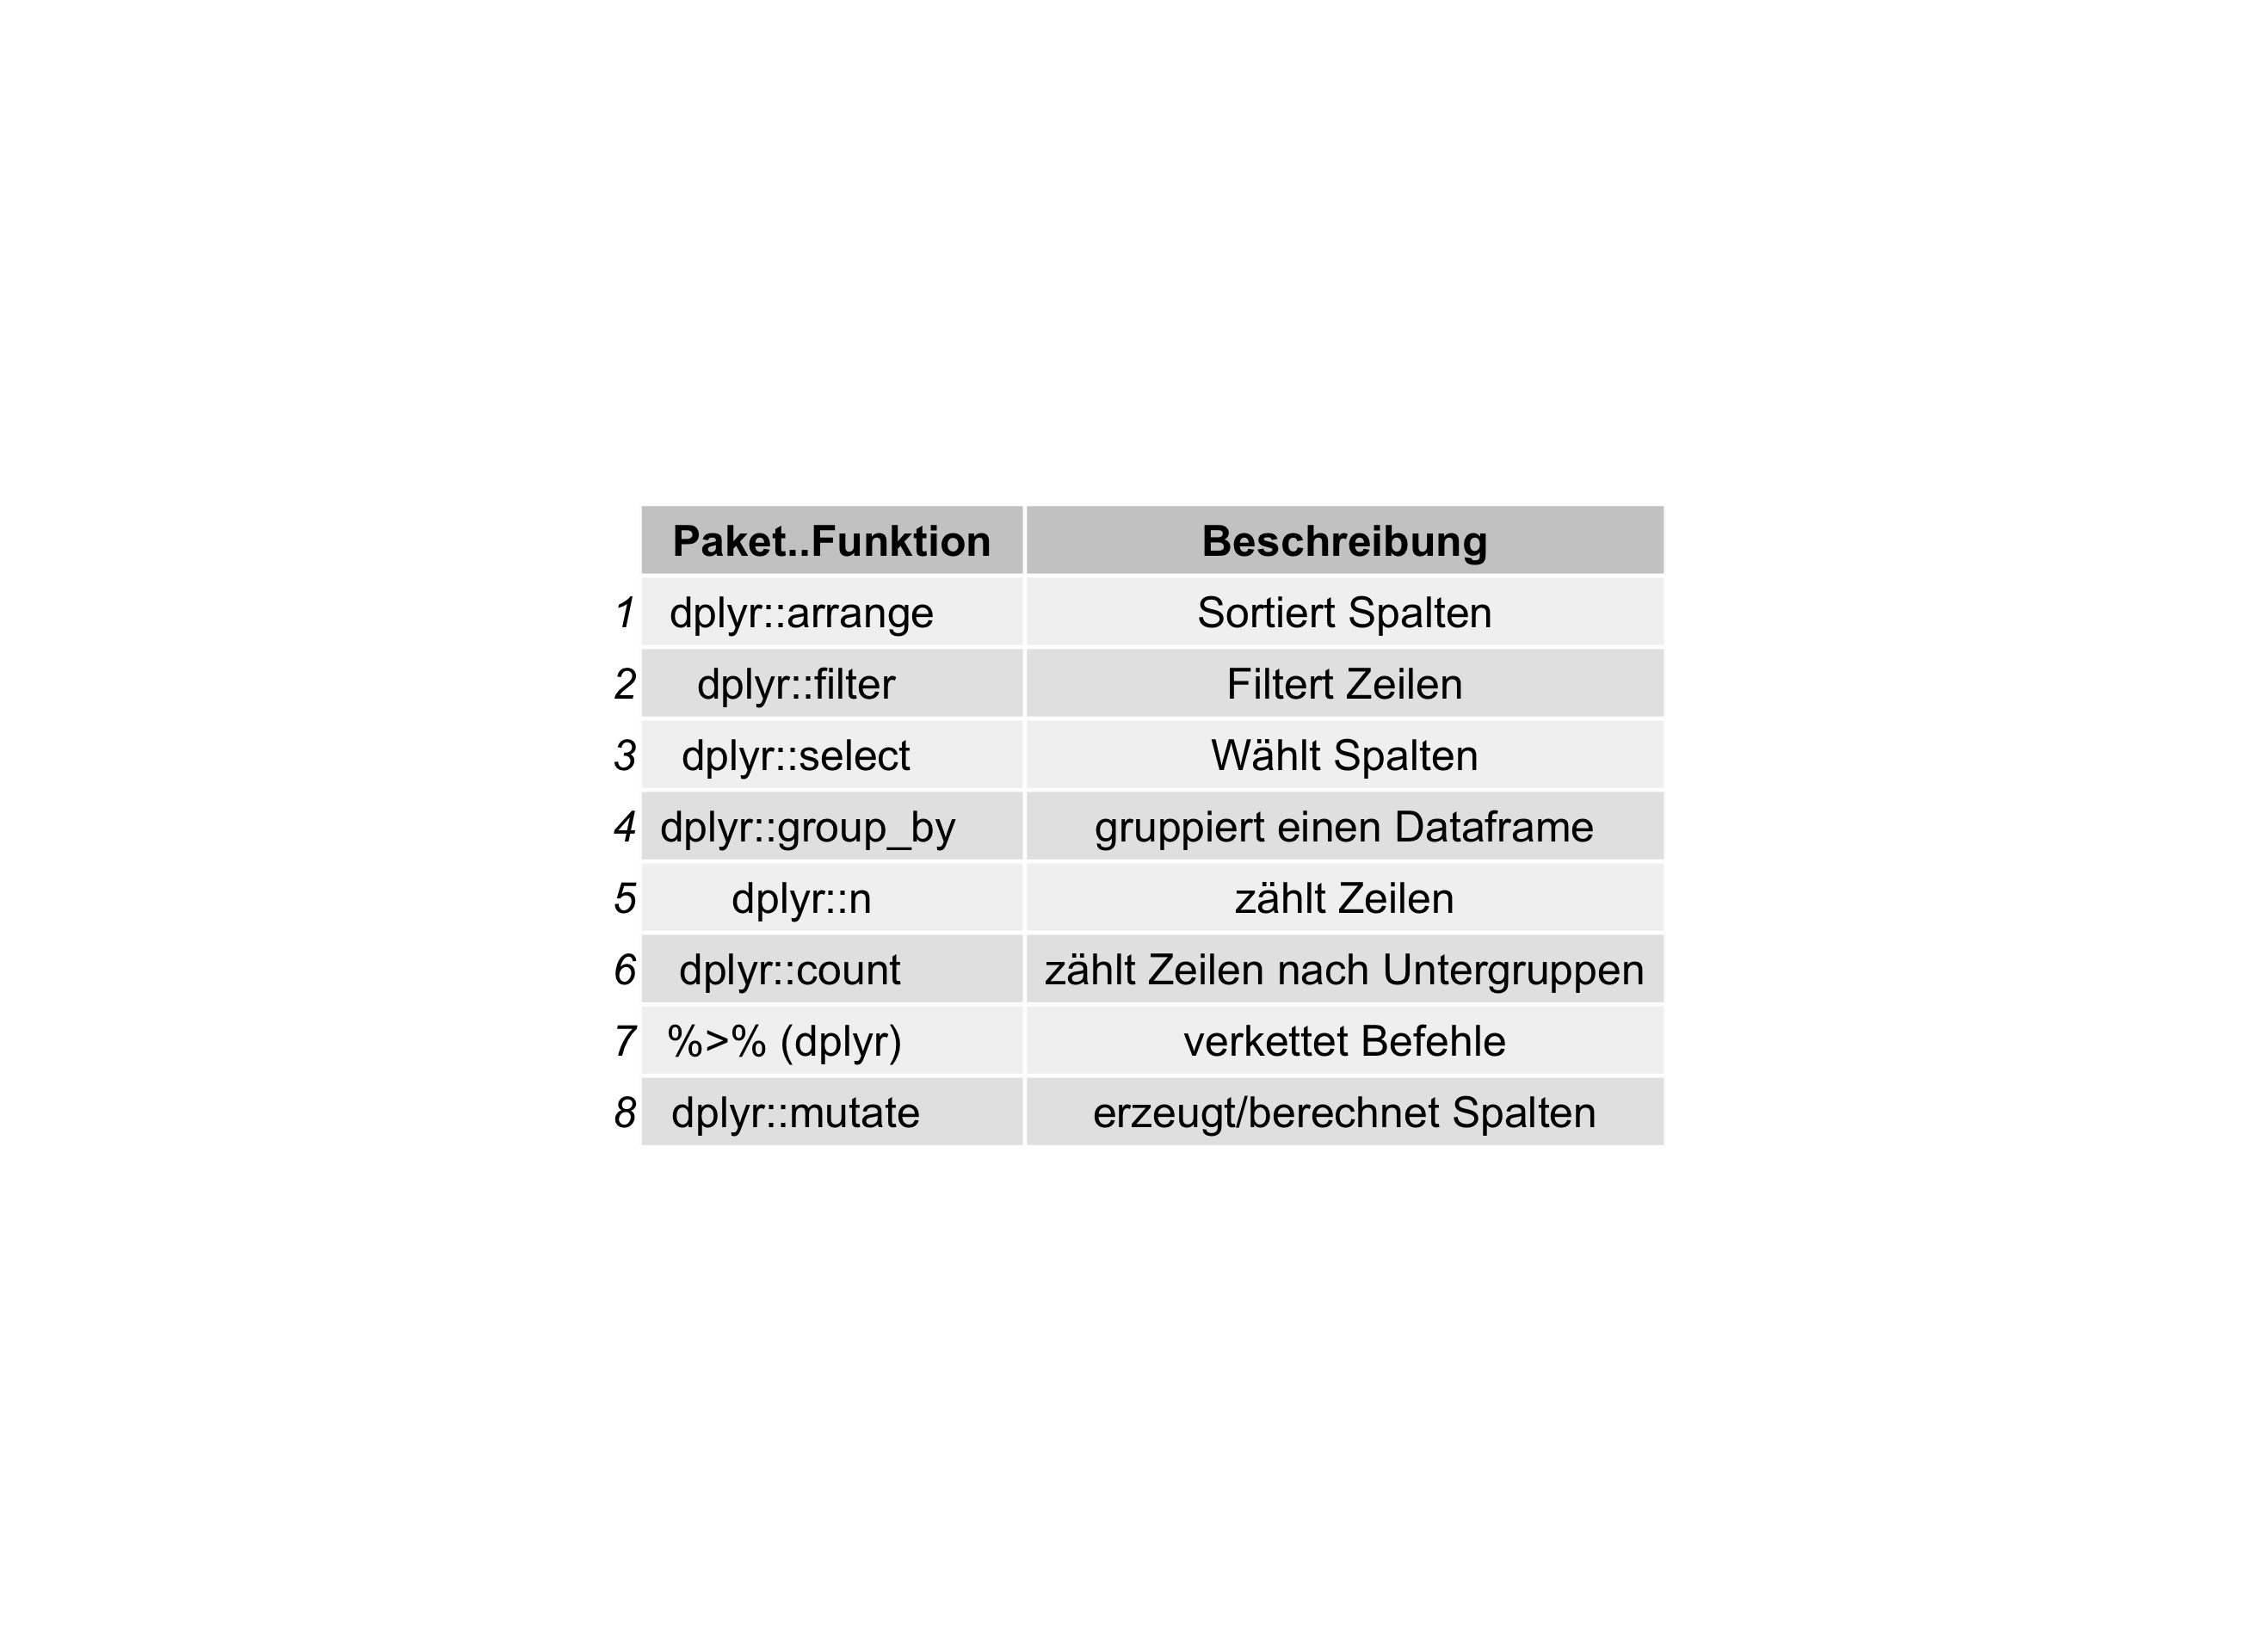
tl;dr
Use this convenience function to print a dataframe as a png-plot: tab2grob().
Source the function here: https://sebastiansauer.github.io/Rcode/tab2grob.R
Easiest way in R:
source("https://sebastiansauer.github.io/Rcode/tab2grob.R")
Printing csv-dataframes as ggplot plots
Recently, I wanted to print dataframes not as normal tables, but as a png-plot. See:

Why? Well, basically as a convenience function for colleagues who are not into using Markdown & friends. As I am preparing some stats stuff (see my new open access course material here) using RMarkdown, I wanted to prepare the materials ready for using in Powerpoint.
I found out that tables are difficult to copy-paste into Powerpoint. That’s why I thought it may help to print to tables as plots.
So I came up with some function who does this job:
- Scan a folder for all csv files
- parse each csv and for each csv file
- print it as a plot
- save it as a png
Rcode
tab2plot <- function(path = "") {

  # Print csv-dataframes as plots using ggplot2 - for easier handling in Powerpoint & friends
  # Arguments
  # path: are the csv-files in a subdirectory? Then specify here. Defaults to "" (working directory)
  # Value:
  # None. Saves each csv-file as png file of the table.

  library(tidyverse)
  library(stringr)
  library(gridExtra)
  library(grid)

    df <- data_frame(
    file_name = list.files(path = path, pattern = "\\w+.csv"),
    title = str_extract(file_name, pattern = "\\w+")
  )

  tt <- ttheme_default(core=list(fg_params=list(hjust=0, x=0.1)))


  for (i in seq_along(df$file_name)) {
    cat(paste0(df$file_name[i], "\n"))
    csv_i <- read.csv(paste0(path, df$file_name[i]))
    #csv_i <- read.csv("includes/Befehle_Cluster.csv")
    csv_i %>%
      rownames_to_column %>%
      dplyr::select(-rowname) -> csv_i
    p <- arrangeGrob(tableGrob(csv_i, theme = tt))
    ggsave(file = paste0("images/Tabellen/","Tabelle_",df$title[i],".png"),  p)
  }

}