I found myself doing the following: I had a bunch of predictors, one (numeric) outcome, and wanted to run I simple regression for each of the predictors. Having a bunch of model results, I would like to have them bundled in one data frame.
So, here is one way to do it.
First, load some data.
data(mtcars)
str(mtcars)
## 'data.frame':	32 obs. of  11 variables:
##  $ mpg : num  21 21 22.8 21.4 18.7 18.1 14.3 24.4 22.8 19.2 ...
##  $ cyl : num  6 6 4 6 8 6 8 4 4 6 ...
##  $ disp: num  160 160 108 258 360 ...
##  $ hp  : num  110 110 93 110 175 105 245 62 95 123 ...
##  $ drat: num  3.9 3.9 3.85 3.08 3.15 2.76 3.21 3.69 3.92 3.92 ...
##  $ wt  : num  2.62 2.88 2.32 3.21 3.44 ...
##  $ qsec: num  16.5 17 18.6 19.4 17 ...
##  $ vs  : num  0 0 1 1 0 1 0 1 1 1 ...
##  $ am  : num  1 1 1 0 0 0 0 0 0 0 ...
##  $ gear: num  4 4 4 3 3 3 3 4 4 4 ...
##  $ carb: num  4 4 1 1 2 1 4 2 2 4 ...
Say, mpg is our outcome/ criterion. The rest of the variables are predictors.
Then, some packages.
library(dplyr)
library(purrr)
library(tibble)
library(ggplot2)
library(stringr)
library(tidyr)
library(broom)
library(scales)
For illustration, let’s run a regression with each and all of the predictors as a preliminary step.
lm(mpg ~ ., data = mtcars) %>% glance
##   r.squared adj.r.squared    sigma statistic      p.value df    logLik
## 1 0.8690158     0.8066423 2.650197  13.93246 3.793152e-07 11 -69.85491
##        AIC      BIC deviance df.residual
## 1 163.7098 181.2986 147.4944          21
lm(mpg ~ ., data = mtcars) %>% summary %>% tidy
##           term    estimate   std.error  statistic    p.value
## 1  (Intercept) 12.30337416 18.71788443  0.6573058 0.51812440
## 2          cyl -0.11144048  1.04502336 -0.1066392 0.91608738
## 3         disp  0.01333524  0.01785750  0.7467585 0.46348865
## 4           hp -0.02148212  0.02176858 -0.9868407 0.33495531
## 5         drat  0.78711097  1.63537307  0.4813036 0.63527790
## 6           wt -3.71530393  1.89441430 -1.9611887 0.06325215
## 7         qsec  0.82104075  0.73084480  1.1234133 0.27394127
## 8           vs  0.31776281  2.10450861  0.1509915 0.88142347
## 9           am  2.52022689  2.05665055  1.2254035 0.23398971
## 10        gear  0.65541302  1.49325996  0.4389142 0.66520643
## 11        carb -0.19941925  0.82875250 -0.2406258 0.81217871
Of interest, no p-value is below .05.
Now come the main part, let’s run multiple regression and then combine the results.
mtcars %>%
  dplyr::select(-mpg) %>%
  map(~lm(mtcars$mpg ~ .x, data = mtcars)) %>%
  map(summary) %>%
  map("coefficients") %>%
  do.call(rbind.data.frame, .) %>%
  rownames_to_column %>%
  as_tibble %>%
  setNames(c("predictor", "b", "SE", "t", "p")) %>%
  dplyr::arrange(p) %>%
  dplyr::filter(!str_detect(predictor, "(Intercept)")) %>%
  mutate(predictor = str_sub(predictor, start = 1, end = str_length(predictor)-3))
## # A tibble: 10 × 5
##    predictor           b          SE         t            p
##        <chr>       <dbl>       <dbl>     <dbl>        <dbl>
## 1         wt -5.34447157 0.559101045 -9.559044 1.293959e-10
## 2        cyl -2.87579014 0.322408883 -8.919699 6.112687e-10
## 3       disp -0.04121512 0.004711833 -8.747152 9.380327e-10
## 4         hp -0.06822828 0.010119304 -6.742389 1.787835e-07
## 5       drat  7.67823260 1.506705108  5.096042 1.776240e-05
## 6         vs  7.94047619 1.632370025  4.864385 3.415937e-05
## 7         am  7.24493927 1.764421632  4.106127 2.850207e-04
## 8       carb -2.05571870 0.568545640 -3.615750 1.084446e-03
## 9       gear  3.92333333 1.308130699  2.999191 5.400948e-03
## 10      qsec  1.41212484 0.559210130  2.525213 1.708199e-02
Some explanation:
- l2: deselect the outcome variable, so that we can address “all” variables in the next lines
- l3: map each list element to
lm;.xis a placeholder for all the list elements (here predictors) - l4: now get the summary of each lm. More specifically, we have a number of lm models, which are stored as list elements. Now we apply the
summaryfunction to each of those list elements (lm results). - l5: address (extract) the
coefficientssubelement from each list element - l6: rownames should be their own column
- l7: tibbles are nic
- l8: make the col names typing-friendly
- l9: filter those lines, where
predictoris not equal to “(Intercept)”. - l10: change the values of
predictorsuch that the strange end part “..x” is removed
Puh, quite some hassle.
Now, for completeness, let’s look at the $R^2$.
mtcars %>%
  dplyr::select(-mpg) %>%
  map(~lm(mtcars$mpg ~ .x, data = mtcars)) %>%
  map(glance) %>%
  do.call(rbind.data.frame, .) %>%
  rownames_to_column %>%
  as_tibble
## # A tibble: 10 × 12
##    rowname r.squared adj.r.squared    sigma statistic      p.value    df
##      <chr>     <dbl>         <dbl>    <dbl>     <dbl>        <dbl> <int>
## 1      cyl 0.7261800     0.7170527 3.205902 79.561028 6.112687e-10     2
## 2     disp 0.7183433     0.7089548 3.251454 76.512660 9.380327e-10     2
## 3       hp 0.6024373     0.5891853 3.862962 45.459803 1.787835e-07     2
## 4     drat 0.4639952     0.4461283 4.485409 25.969645 1.776240e-05     2
## 5       wt 0.7528328     0.7445939 3.045882 91.375325 1.293959e-10     2
## 6     qsec 0.1752963     0.1478062 5.563738  6.376702 1.708199e-02     2
## 7       vs 0.4409477     0.4223126 4.580827 23.662241 3.415937e-05     2
## 8       am 0.3597989     0.3384589 4.902029 16.860279 2.850207e-04     2
## 9     gear 0.2306734     0.2050292 5.373695  8.995144 5.400948e-03     2
## 10    carb 0.3035184     0.2803024 5.112961 13.073646 1.084446e-03     2
## # ... with 5 more variables: logLik <dbl>, AIC <dbl>, BIC <dbl>,
## #   deviance <dbl>, df.residual <int>
Ok, I admit, I like plotting, particularly with ggplot2.
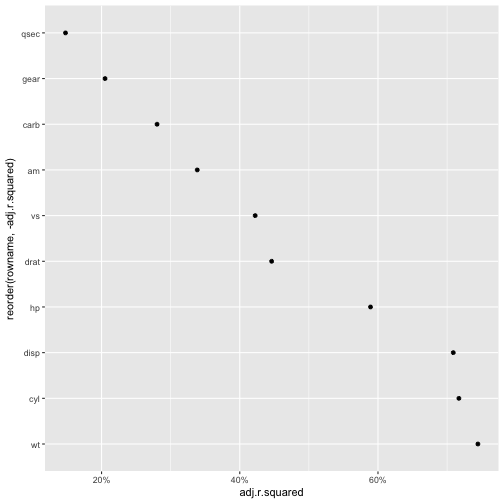
First, the $R^2$ for all models:
mtcars %>%
  dplyr::select(-mpg) %>%
  map(~lm(mtcars$mpg ~ .x, data = mtcars)) %>%
  map(glance) %>%
  do.call(rbind.data.frame, .) %>%
  rownames_to_column %>%
  as_tibble %>%
  ggplot(aes(x = reorder(rowname, -adj.r.squared), y = adj.r.squared)) +
  geom_point() +
  coord_flip() +
  scale_y_continuous(labels = scales::percent)

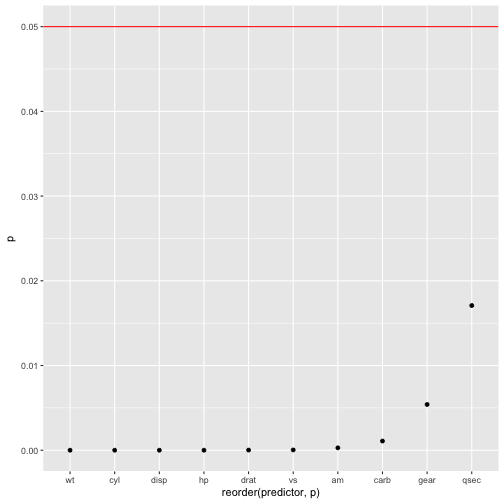
Last, the p-values of each predictor (OMG).
mtcars %>%
  dplyr::select(-mpg) %>%
  map(~lm(mtcars$mpg ~ .x, data = mtcars)) %>%
  map(summary) %>%
  map("coefficients") %>%
  do.call(rbind.data.frame, .) %>%
  rownames_to_column %>%
  as_tibble %>%
  setNames(c("predictor", "b", "SE", "t", "p")) %>%
  dplyr::arrange(p) %>%
  dplyr::filter(!str_detect(predictor, "(Intercept)")) %>%
  mutate(predictor = str_sub(predictor, start = 1, end = str_length(predictor)-3)) %>%
  ggplot(aes(x = reorder(predictor,p), y = p)) +
  geom_point() +
  geom_hline(yintercept = .05, color = "red")
