Hadley Wickham’s purrr has given a new look at handling data structures to the typical R user (some reasoning suggests that average users don’t exist, but that’s a different story).
I just tried the following with purrr:
- Meditate about the running a simple regression, FWIW
- Take a dataframe with candidate predictors and an outcome
- Throw one predictor at a time into the regression, where the outcome variable remains the same (i.,e multiple simple regressions (one predictor) where the predictor is changed at each run but the outcome remains the same)
- tidy up the resulting $$ R^2 $$ in some nice format.
I found that purrr does the job nicely, and it’s quite instructive, I think. That’s why I wrote it up in this short post:
library(purrr)
library(ggplot2)
library(dplyr)
library(broom)
library(knitr)  # for kable
data(Fair, package = "Ecdat") # extramarital affairs dataset
glimpse(Fair)
## Observations: 601
## Variables: 9
## $ sex        <fctr> male, female, female, male, male, female, female, ...
## $ age        <dbl> 37, 27, 32, 57, 22, 32, 22, 57, 32, 22, 37, 27, 47,...
## $ ym         <dbl> 10.00, 4.00, 15.00, 15.00, 0.75, 1.50, 0.75, 15.00,...
## $ child      <fctr> no, no, yes, yes, no, no, no, yes, yes, no, yes, y...
## $ religious  <int> 3, 4, 1, 5, 2, 2, 2, 2, 4, 4, 2, 4, 5, 2, 4, 1, 2, ...
## $ education  <dbl> 18, 14, 12, 18, 17, 17, 12, 14, 16, 14, 20, 18, 17,...
## $ occupation <int> 7, 6, 1, 6, 6, 5, 1, 4, 1, 4, 7, 6, 6, 5, 5, 5, 4, ...
## $ rate       <int> 4, 4, 4, 5, 3, 5, 3, 4, 2, 5, 2, 4, 4, 4, 4, 5, 3, ...
## $ nbaffairs  <dbl> 0, 0, 0, 0, 0, 0, 0, 0, 0, 0, 0, 0, 0, 0, 0, 0, 0, ...
Fair %>%
  dplyr::select(-nbaffairs) %>%  # exclude outcome, leave only predictors
  map(~lm(Fair$nbaffairs ~ .x, data = Fair)) %>%
  map(summary) %>%
  map_dbl("r.squared") %>%
  tidy %>%
  dplyr::arrange(desc(x)) %>%
  rename(r.squared = x) -> r2s

kable(r2s)
| names | r.squared |
|---|---|
| rate | 0.0781272 |
| ym | 0.0349098 |
| religious | 0.0208806 |
| child | 0.0108181 |
| age | 0.0090701 |
| occupation | 0.0024613 |
| sex | 0.0001377 |
| education | 0.0000059 |
Ok, that appears to be the list of the $$ R^{2} $$ for each simple (one-predictor) regression we have run.
Let’s do a quick sense check with the standard way:
lm1 <- lm(nbaffairs ~ rate, data = Fair)

summary(lm1)
##
## Call:
## lm(formula = nbaffairs ~ rate, data = Fair)
##
## Residuals:
##     Min      1Q  Median      3Q     Max
## -3.9063 -1.3989 -0.5631 -0.5631 11.4369
##
## Coefficients:
##             Estimate Std. Error t value Pr(>|t|)
## (Intercept)   4.7421     0.4790   9.900   <2e-16 ***
## rate         -0.8358     0.1173  -7.125    3e-12 ***
## ---
## Signif. codes:  0 '***' 0.001 '**' 0.01 '*' 0.05 '.' 0.1 ' ' 1
##
## Residual standard error: 3.17 on 599 degrees of freedom
## Multiple R-squared:  0.07813,	Adjusted R-squared:  0.07659
## F-statistic: 50.76 on 1 and 599 DF,  p-value: 3.002e-12
summary(lm1)$r.squared
## [1] 0.07812718
summary(lm1)$coefficients[2, 4] #p.value
## [1] 3.002385e-12
Seems to work. To get details of the object summary(lm1), use str(summary(lm1)).
How many did we run? Just the number of columns minus one (the outcome variable).
ncol(Fair)-1
## [1] 8
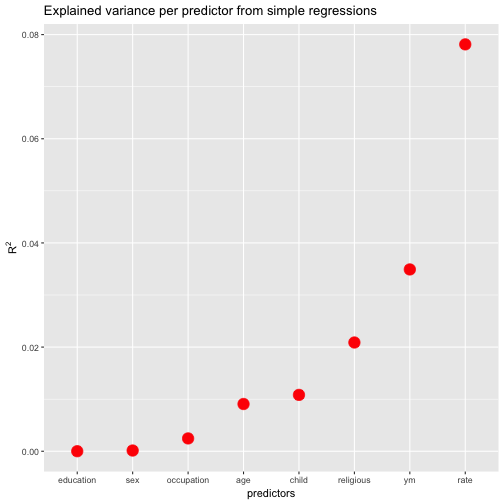
FWIW, let’s plot the resulting values (and sort the predictors by descending values).
ggplot(r2s, aes(x = reorder(names, r.squared), y = r.squared)) +
  geom_point(size = 5, color = "red") +
  ylab(expression(R^{2})) +
  xlab("predictors") +
  ggtitle("Explained variance per predictor from simple regressions")
Wait, one more thing. Suppose we are not only interested in $$ R^{2} $$, but in the p-values (OMG). How to get both values from purrr?.
library(magrittr)

Fair %>%
  dplyr::select(-nbaffairs) %>%  # exclude outcome, leave only predictors
  map(~lm(Fair$nbaffairs ~ .x, data = Fair)) %>%
  map(summary) %>%
  map(c("coefficients")) %>%
  map_dbl(8)  %>% # 8th element is the p-value
  tidy %>%
  dplyr::arrange(desc(x)) %>%
  rename(p.value = x) -> ps


kable(ps)
| names | p.value |
|---|---|
| education | 0.9524501 |
| sex | 0.7740138 |
| occupation | 0.2245709 |
| age | 0.0195320 |
| child | 0.0107275 |
| religious | 0.0003797 |
| ym | 0.0000040 |
| rate | 0.0000000 |
Extracting the p-value by map_dbl(8) is surely far from perfect. Any ideas how to better get the value out of this numeric 2*4 matrix? Thoughts are welcome!